01 · Metrics
KPI definition
Aligned with staffing operators on the margin, headcount, and efficiency metrics that drive weekly decisions.
Multi-branch
Network view
Margin + KPI
Core signals
2024
Delivery year
Overview
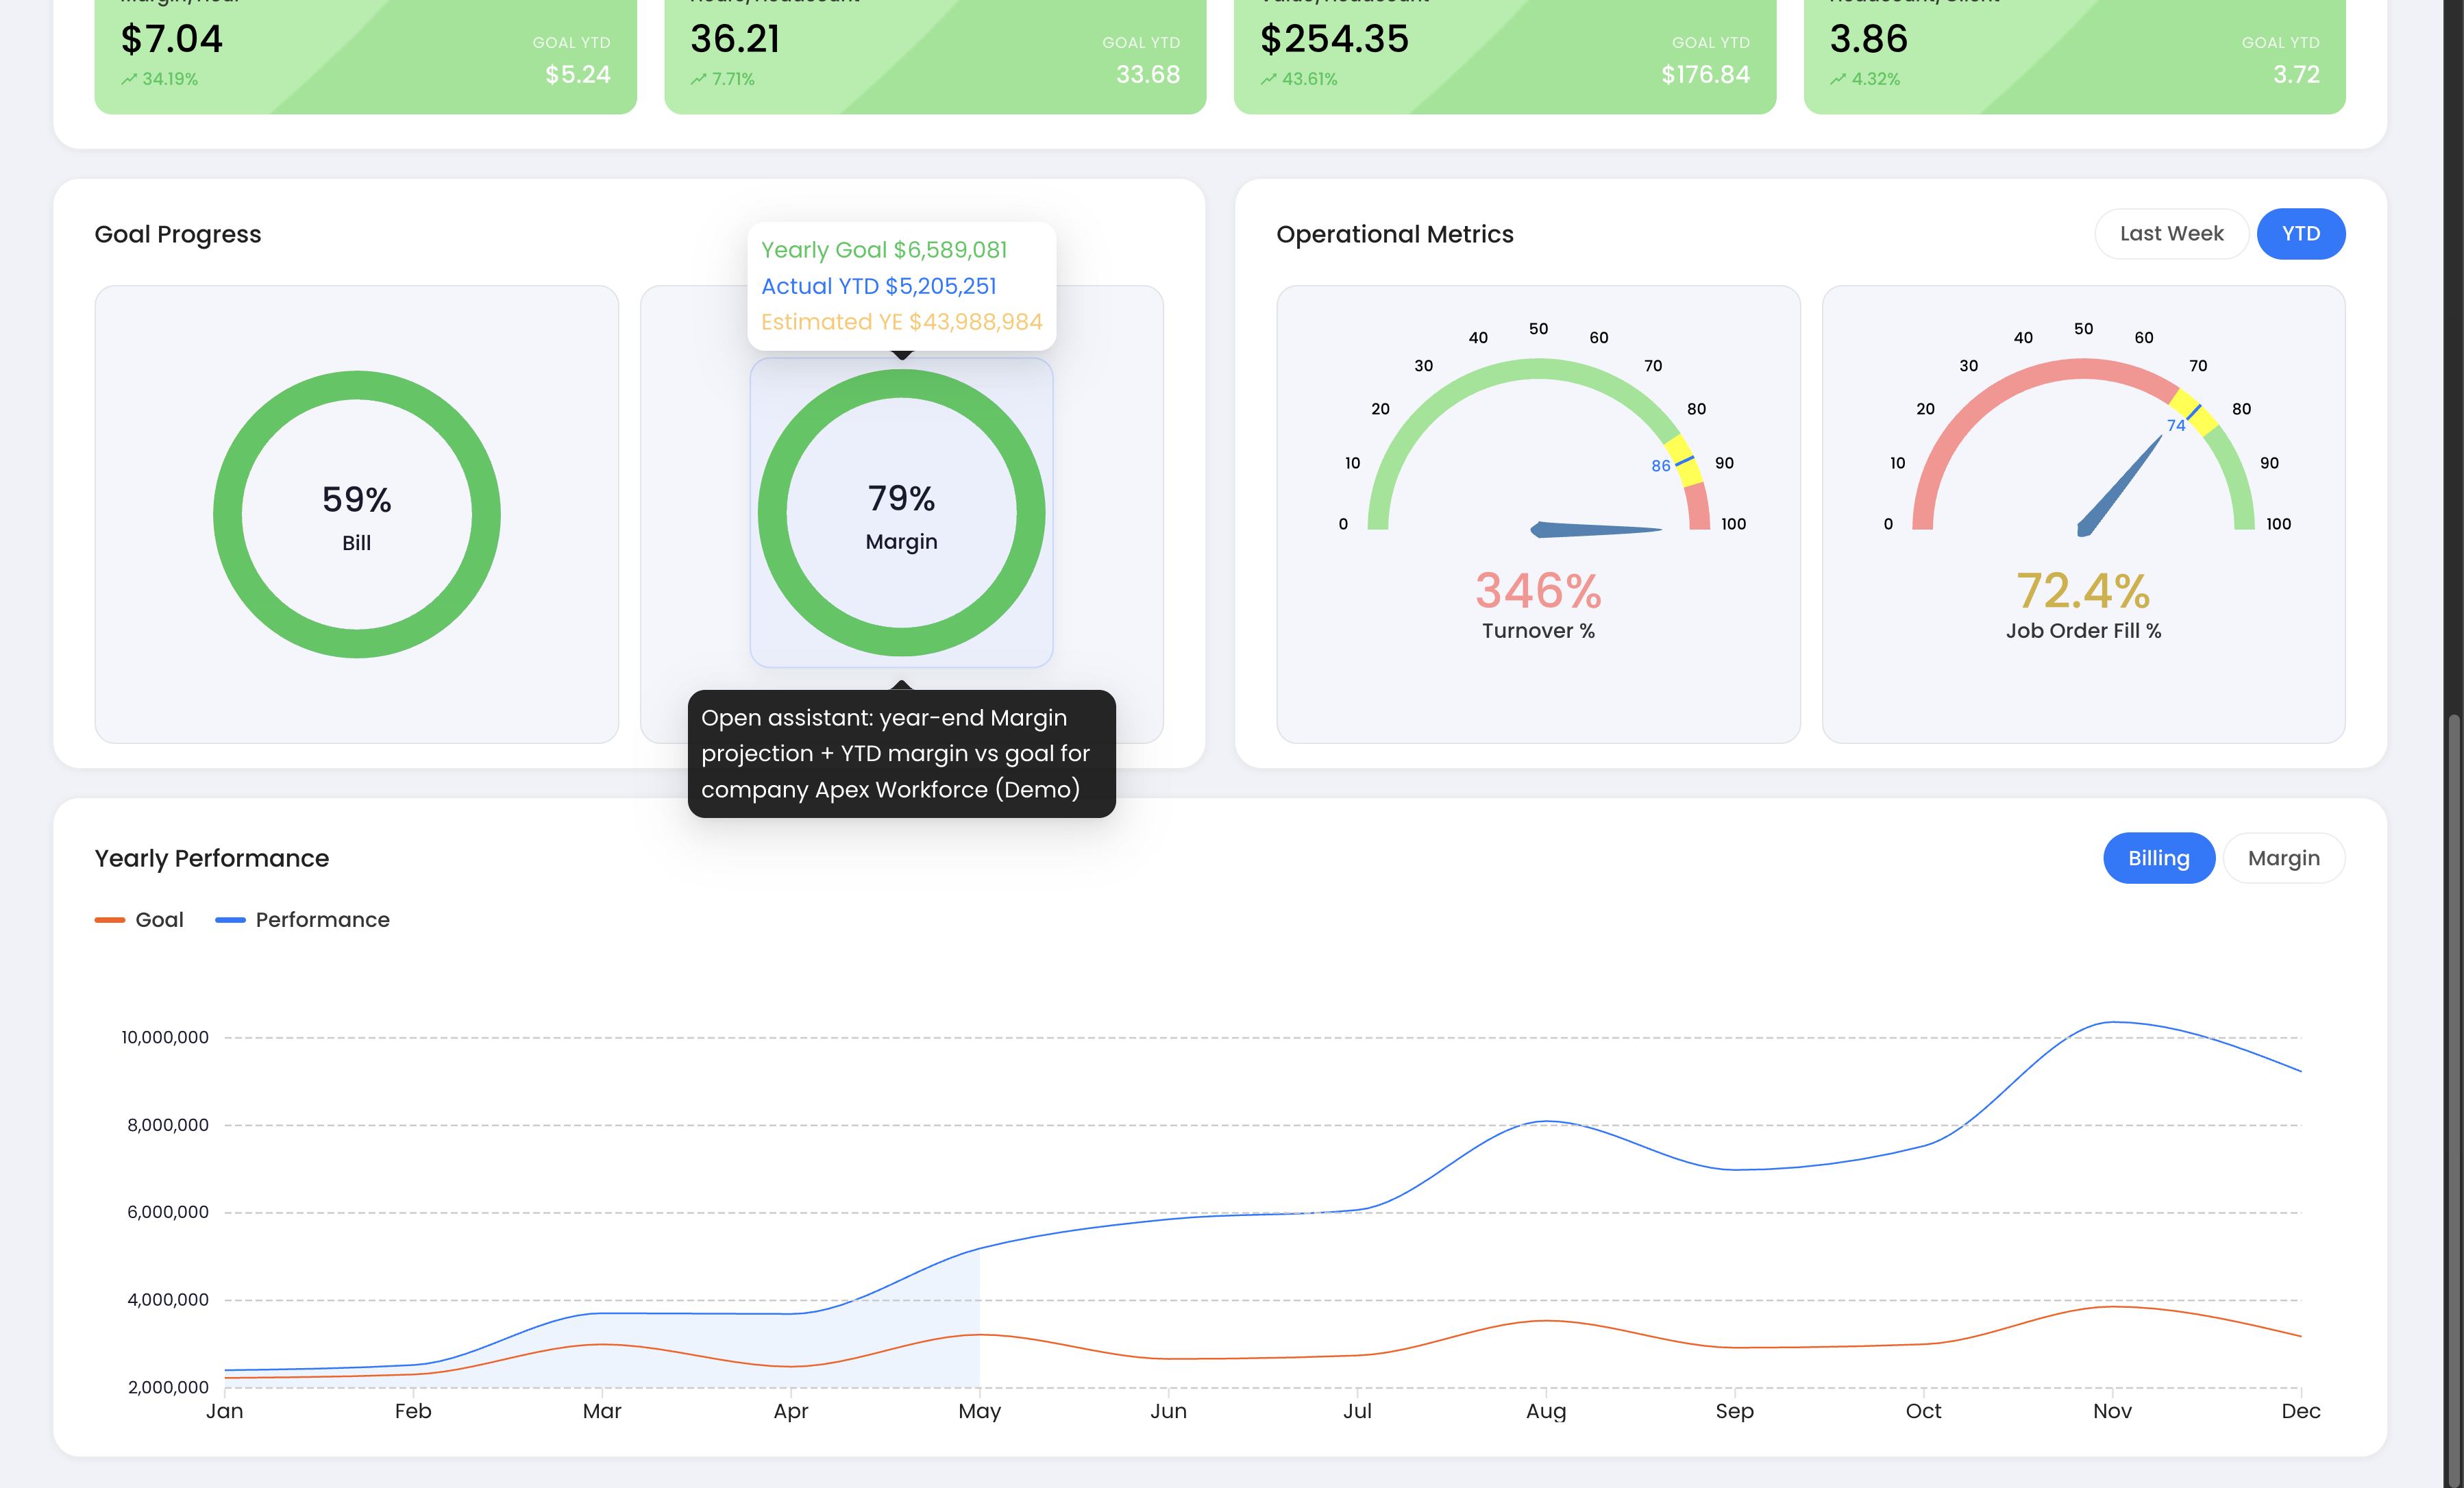
Staffing Dashboard centralizes staffing-agency performance into a single operational surface. StartxLabs designed and built overview, sales, and KPI views that show year-to-date margin against goal, branch-level projections, and granular metrics - starts, ends, bill/pay/margin, headcount, and efficiency - so leadership can manage a multi-branch network from one screen.
The challenge
Staffing leadership was managing margin, headcount, and branch performance across fragmented reports - making it hard to see who was ahead of goal and where operations were slipping.
Multi-branch margin goals needed a single goal-pace view
Regional offices required comparable performance cards
Operational KPIs (starts, ends, bill, pay, margin, headcount) lived in silos
Managers needed weekly and yearly views without losing signal
Our solution
We delivered a staffing BI dashboard with goal-pace visualization, branch scorecards, and a dense KPI grid designed for daily leadership review - including mobile access for on-the-go checks.
Designed margin goal progress with YTD actuals and year-end projections
Built branch performance cards for multi-location comparison
Structured a KPI grid covering hiring lifecycle, financials, and efficiency
Added mobile companion views for leadership away from the desk
Delivery process
01 · Metrics
Aligned with staffing operators on the margin, headcount, and efficiency metrics that drive weekly decisions.
02 · Design
Designed goal, branch, and KPI layouts that stay readable under dense operational data.
03 · Build
Implemented overview and supporting views for staffing performance monitoring.
04 · Extend
Extended critical performance views to mobile for leadership mobility.
Product gallery
Selected visuals from Staffing Dashboard - product UI, mobile flows, and delivery artifacts from the engagement.
Scope of work
BI UX
Web dashboard
KPI modeling
Mobile views
Key deliverables
Staffing overview dashboard
Branch performance scorecards
Operational KPI grid
Mobile leadership views
Capabilities & stack
Impact
Outcomes from the Staffing Dashboard engagement - measured in how teams operated, how the product matured, and what became possible next.
Leadership could see margin goal pace and branch outliers in one place
Operational KPIs became comparable across the full branch network
Weekly and yearly views supported both tactical and strategic review
Mobile access kept staffing performance visible outside the office
Tell us about the problem - we'll come back with a scoped approach and delivery shape.
Contact Us
Whether you have a detailed brief or just an early idea, we will help you scope it, challenge it, and ship it.
Multi-branch
Network view
Margin + KPI
Core signals
2024
Delivery year
Overview
Staffing Dashboard centralizes staffing-agency performance into a single operational surface. StartxLabs designed and built overview, sales, and KPI views that show year-to-date margin against goal, branch-level projections, and granular metrics - starts, ends, bill/pay/margin, headcount, and efficiency - so leadership can manage a multi-branch network from one screen.
The challenge
Staffing leadership was managing margin, headcount, and branch performance across fragmented reports - making it hard to see who was ahead of goal and where operations were slipping.
Multi-branch margin goals needed a single goal-pace view
Regional offices required comparable performance cards
Operational KPIs (starts, ends, bill, pay, margin, headcount) lived in silos
Managers needed weekly and yearly views without losing signal
Our solution
We delivered a staffing BI dashboard with goal-pace visualization, branch scorecards, and a dense KPI grid designed for daily leadership review - including mobile access for on-the-go checks.
Designed margin goal progress with YTD actuals and year-end projections
Built branch performance cards for multi-location comparison
Structured a KPI grid covering hiring lifecycle, financials, and efficiency
Added mobile companion views for leadership away from the desk
Delivery process
01 · Metrics
Aligned with staffing operators on the margin, headcount, and efficiency metrics that drive weekly decisions.
02 · Design
Designed goal, branch, and KPI layouts that stay readable under dense operational data.
03 · Build
Implemented overview and supporting views for staffing performance monitoring.
04 · Extend
Extended critical performance views to mobile for leadership mobility.
Product gallery
Selected visuals from Staffing Dashboard - product UI, mobile flows, and delivery artifacts from the engagement.
Scope of work
BI UX
Web dashboard
KPI modeling
Mobile views
Key deliverables
Staffing overview dashboard
Branch performance scorecards
Operational KPI grid
Mobile leadership views
Capabilities & stack
Impact
Outcomes from the Staffing Dashboard engagement - measured in how teams operated, how the product matured, and what became possible next.
Leadership could see margin goal pace and branch outliers in one place
Operational KPIs became comparable across the full branch network
Weekly and yearly views supported both tactical and strategic review
Mobile access kept staffing performance visible outside the office
Tell us about the problem - we'll come back with a scoped approach and delivery shape.
Contact Us
Whether you have a detailed brief or just an early idea, we will help you scope it, challenge it, and ship it.